PoldiAutoCorrelation v6#
Summary#
Performs correlation analysis of POLDI 2D-data.
Properties#
Name |
Direction |
Type |
Default |
Description |
|---|---|---|---|---|
InputWorkspace |
Input |
Mandatory |
The workspace containing the input data |
|
OutputWorkspace |
Output |
Mandatory |
Output workspace containing the correlation spectrum. |
|
WavelengthMin |
Input |
number |
1.1 |
Minium wavelength to consider. |
WavelengthMax |
Input |
number |
5 |
Maximum wavelength to consider. |
InterpolationMethod |
Input |
string |
Linear |
Interpolation used when adding intensity to a given bin in correlation function - ‘Nearest’ is quicker but potentially less accurate. Allowed values: [‘Linear’, ‘Nearest’] |
NGroups |
Input |
number |
1 |
Number of groups to split poldi detectors into (returns a spectrum per group) |
Description#
POLDI is a pulse overlap diffractometer and therefore the arrival time of a neutron does not uniquely determine the time-of-flight of the neutron (and hence the d-spacing in a given detector). Neutrons of different wavelength can arrive at the same time having passed through the chopper in a different pulse/slit. Indeed, neutrons corresponding to the same d-spacing are observed at many different arrival times in a given detector due to the overlapping pulses measured.
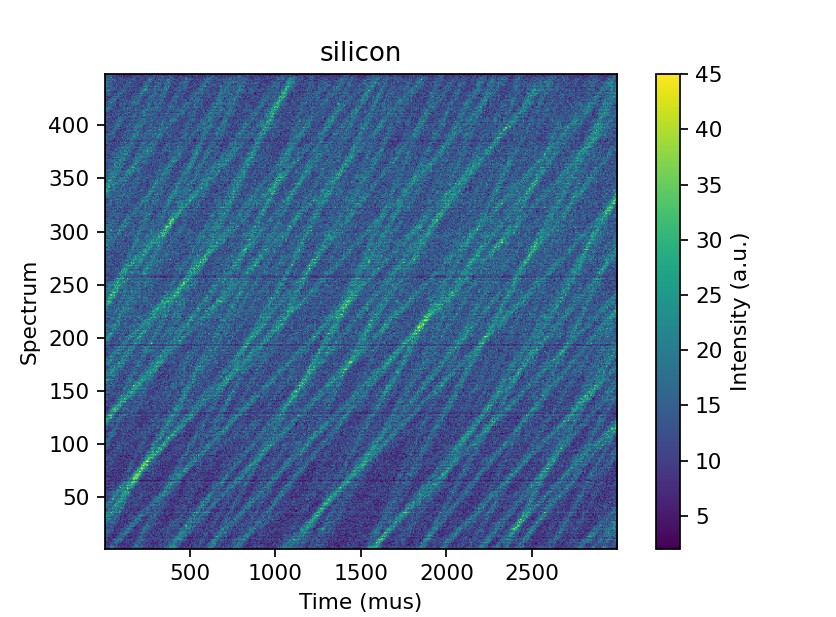
Raw POLDI 1.2 data (i.e. post 2D detector upgrade) for silicon powder standard.#
The output of PoldiAutoCorrelation is a correlation spectrum, similar to the spectrum of a conventional TOF diffractometer. Bragg reflections will appear in this correlation spectrum as peaks surrounded by a dip in the background. The positions of the Bragg peaks can be determined to a high accuracy in the correlation spectrum and indexed accordingly.
PoldiAutoCorrelation performs a type of average of the intensity over different arrival times from each pulse corresponding to a given d-spacing for each detector: the correlation intensity at a given d-spacing is the inverse of the sum of the inverse intensities at each possible arrival time (see Eq. 8 in [1]). A high correlation intensity implies a consistently high intensity was measured at all arrival times due to all possible chopper openings/pulses.
In general the arrival time of a neutron for a given d-spacing will not coincide with a bin-center in the data -
some interpolation is required. There are two interpolation methods which can be specified with the
InterpolationMethod parameter: Linear (default - as in [1]) and Nearest. The Nearest method is a
roughly a factor of 2-3 quicker but is potentially less accurate.
Note by convention the correlation spectrum is converted from d-spacing into momentum transfer.
Further details of the POLDI instrument and the reduction can be found in [1].
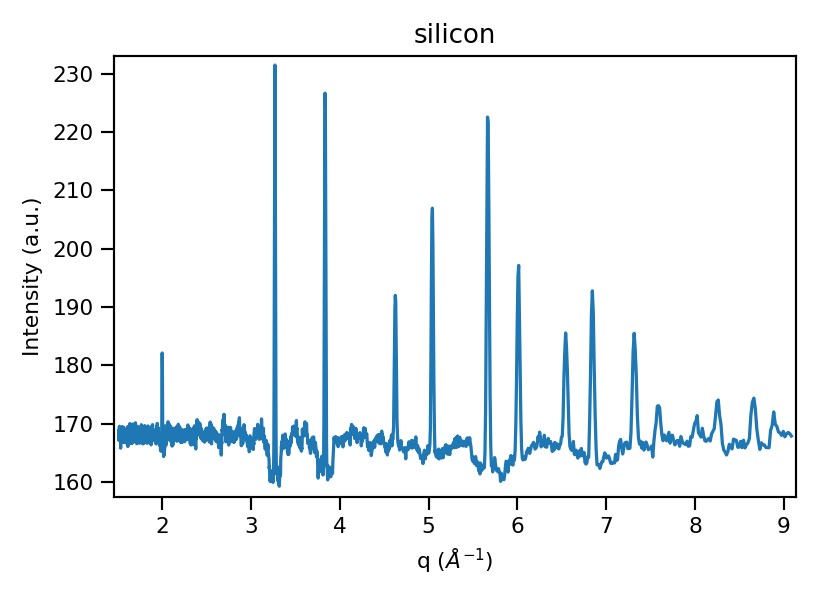
Correlation spectrum of silicon powder standard.#
Usage#
Note POLDI 1.2 is still under development, the data are currently saved in ASCII format with no meta-data required
for the reduction. Currently there is a helper function load_poldi that reads the ASCII file, loads an instrument
definition and adds the appropriate meta-data to the workspace.
from mantid.simpleapi import *
from mantid.api import FileFinder
from plugins.algorithms.poldi_utils import load_poldi

fpath_data = FileFinder.getFullPath("poldi_448x500_chopper5k_silicon.txt")
fpath_idf = FileFinder.getFullPath("POLDI_Definition_448_calibrated.xml")

# load the raw data
ws = load_poldi(fpath_data, fpath_idf, chopper_speed=5000, t0=5.855e-02, t0_const=-9.00)
print(f"The workspace contains {ws.getNumberHistograms()} spectra.")

ws_corr = PoldiAutoCorrelation(InputWorkspace=ws, OutputWorkspace='ws_corr')
print(f"The correlation spectrum has {ws_corr.blocksize()} bins.")
Output:
The workspace contains 448 spectra.
The correlation spectrum has 2833 bins.
References#
Categories: AlgorithmIndex | SINQ\Poldi
Source#
Python: PoldiAutoCorrelation6.py