Formatting Plots with the User Interface#
Plot Type Specific Help
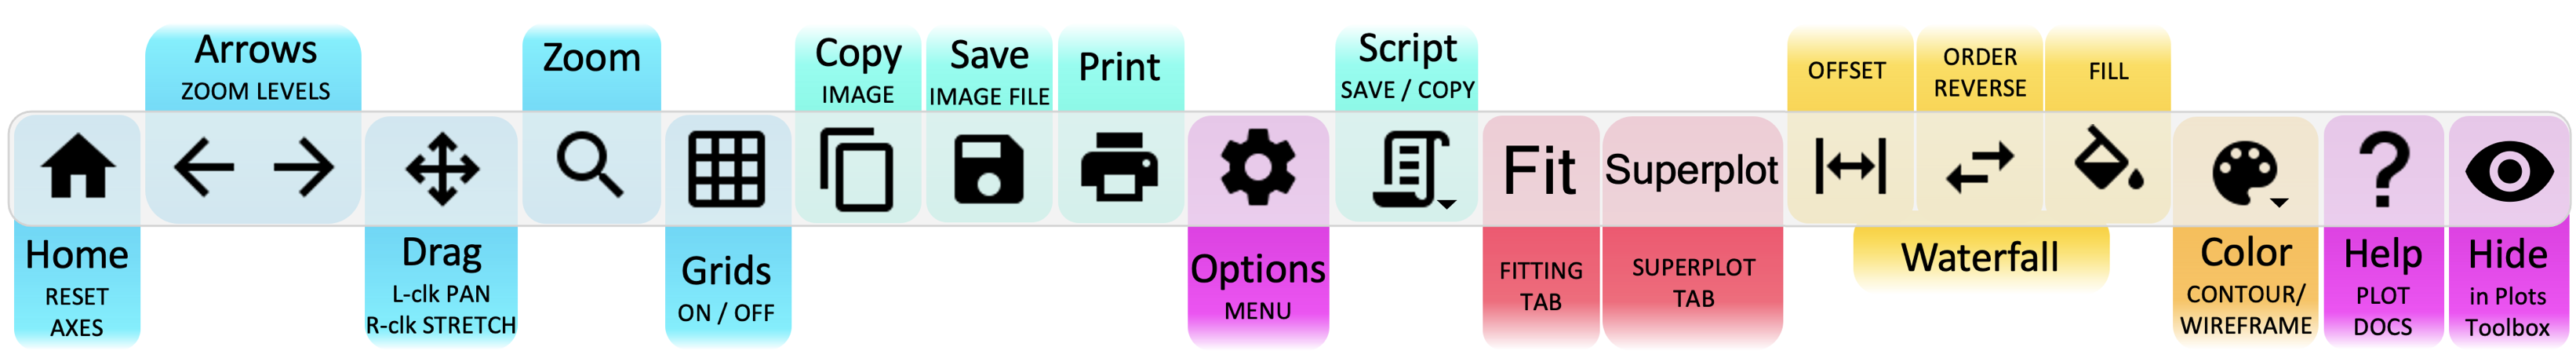
Plot Toolbar#
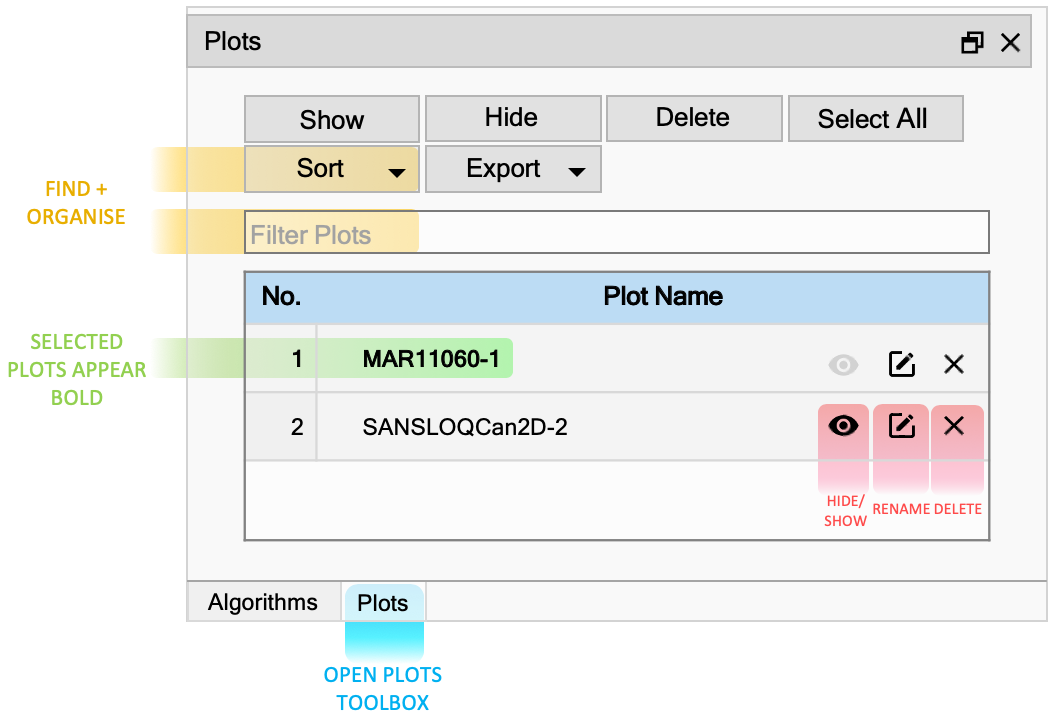
Plots Toolbox#
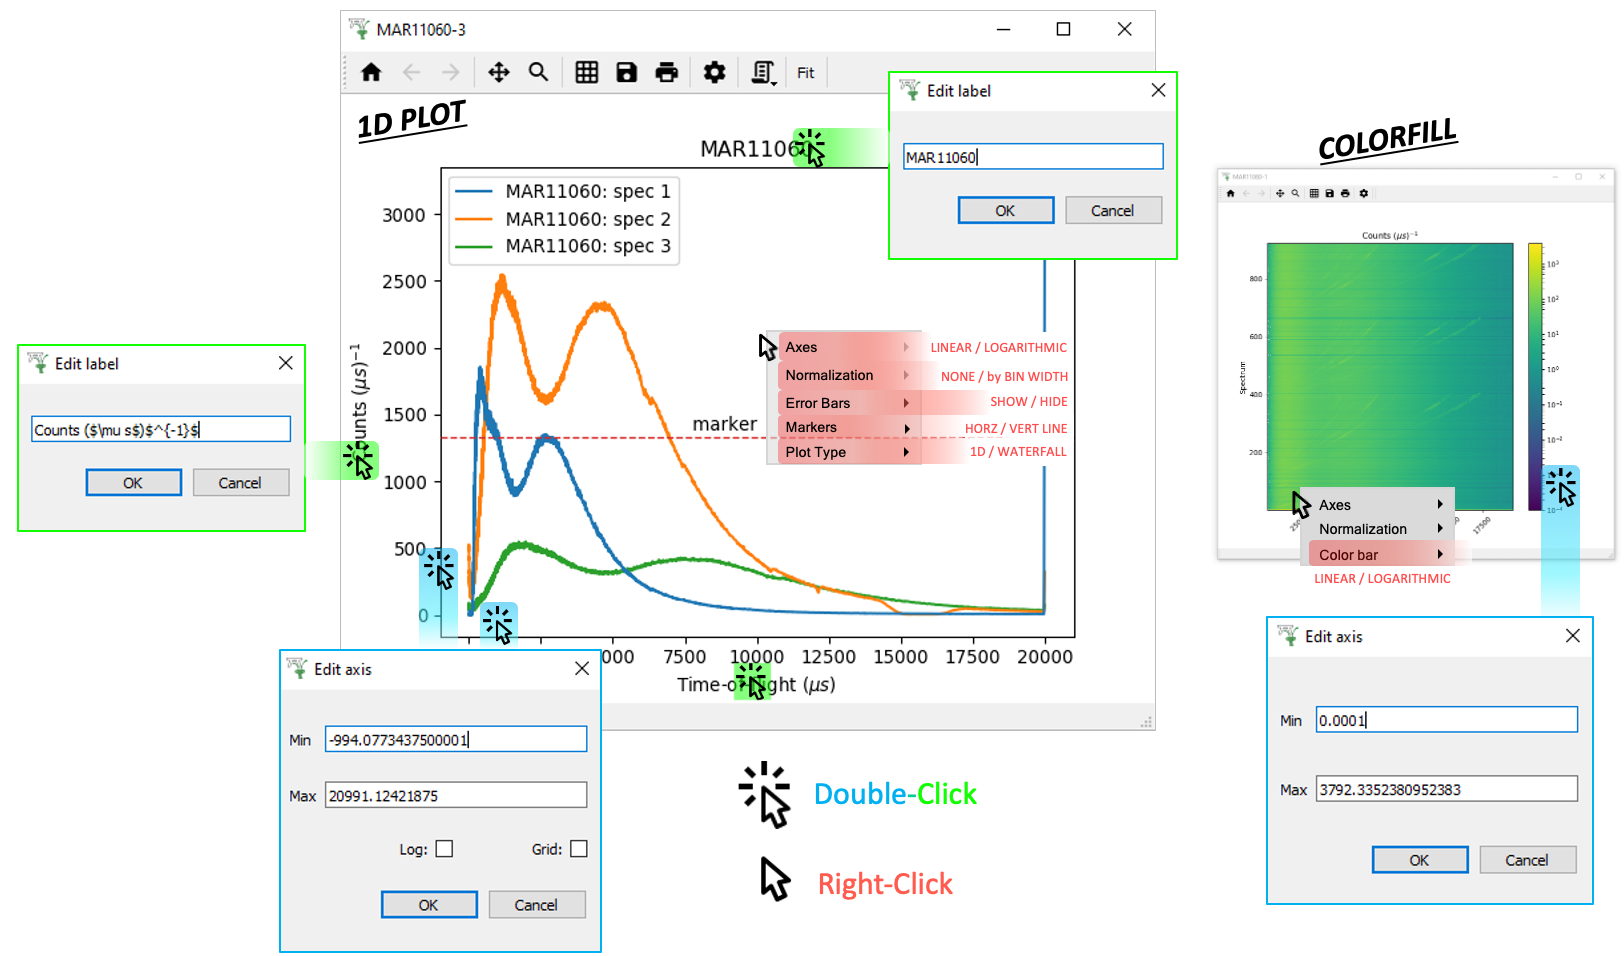
Click Menus#
Options Menu#
1D plots#
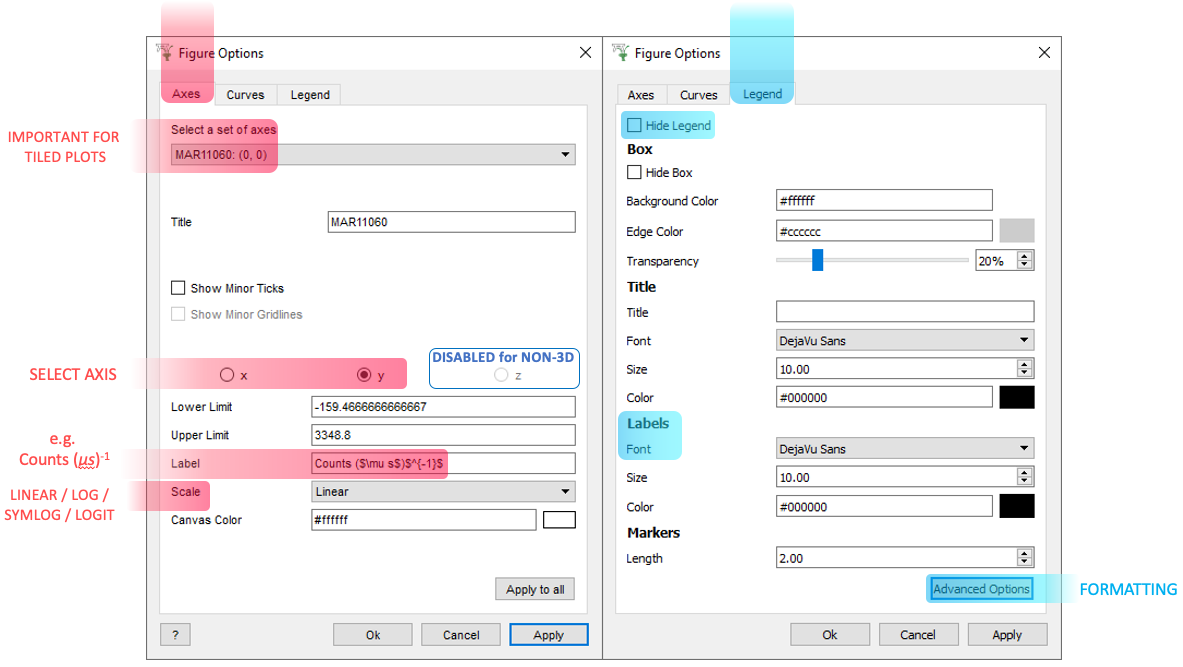
TIP: Change a Legend entry by editing Set curve label on the Curves tab.
Then on the Legend tab there are Color and Font options.
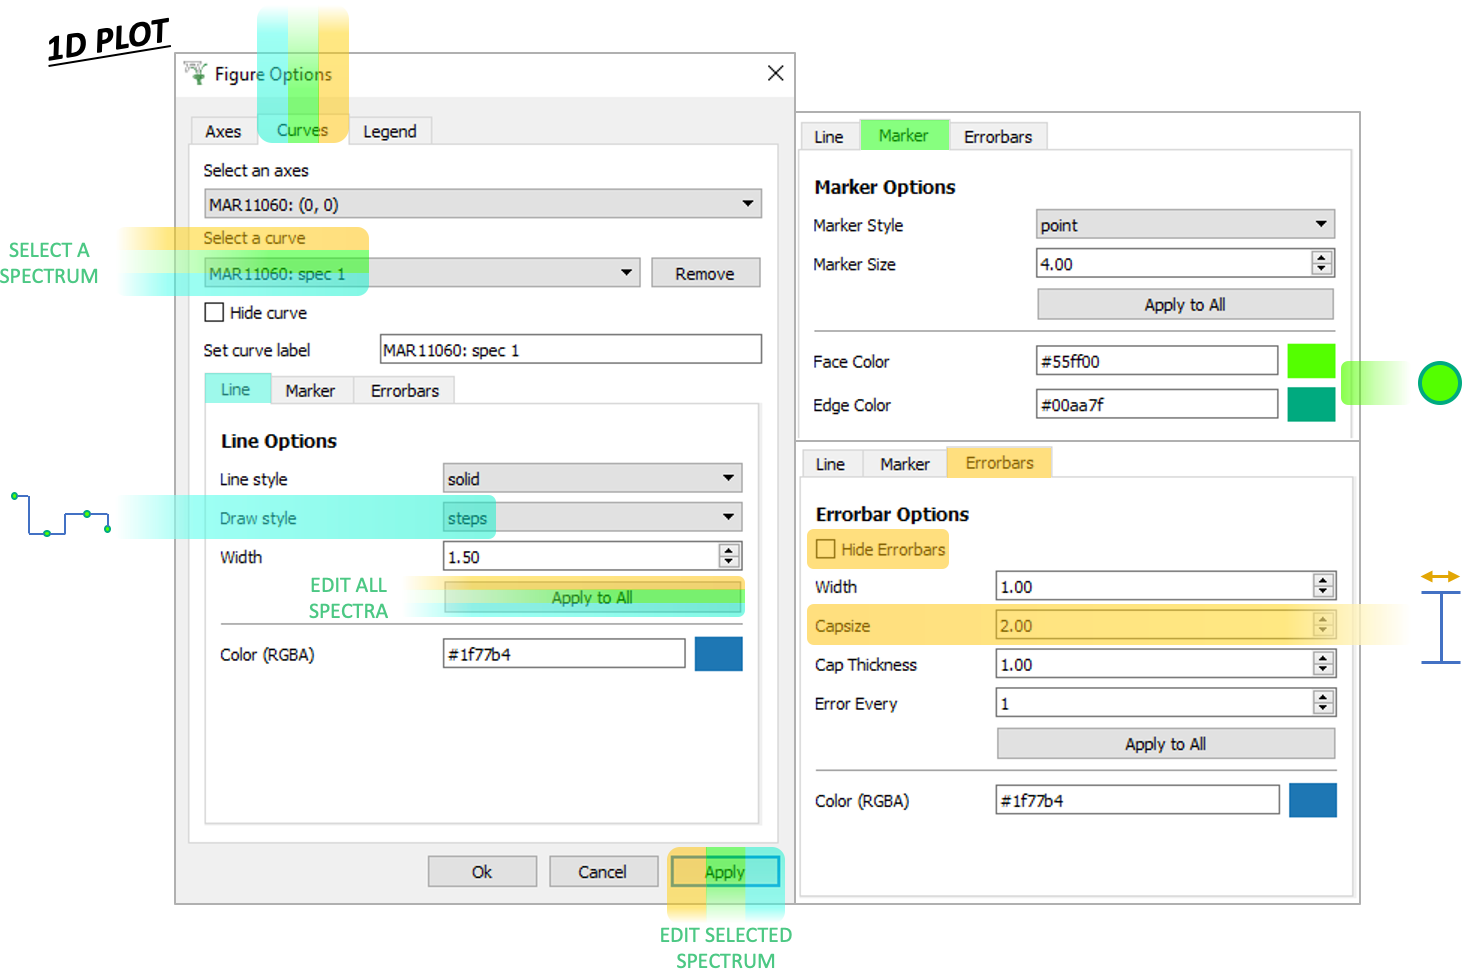
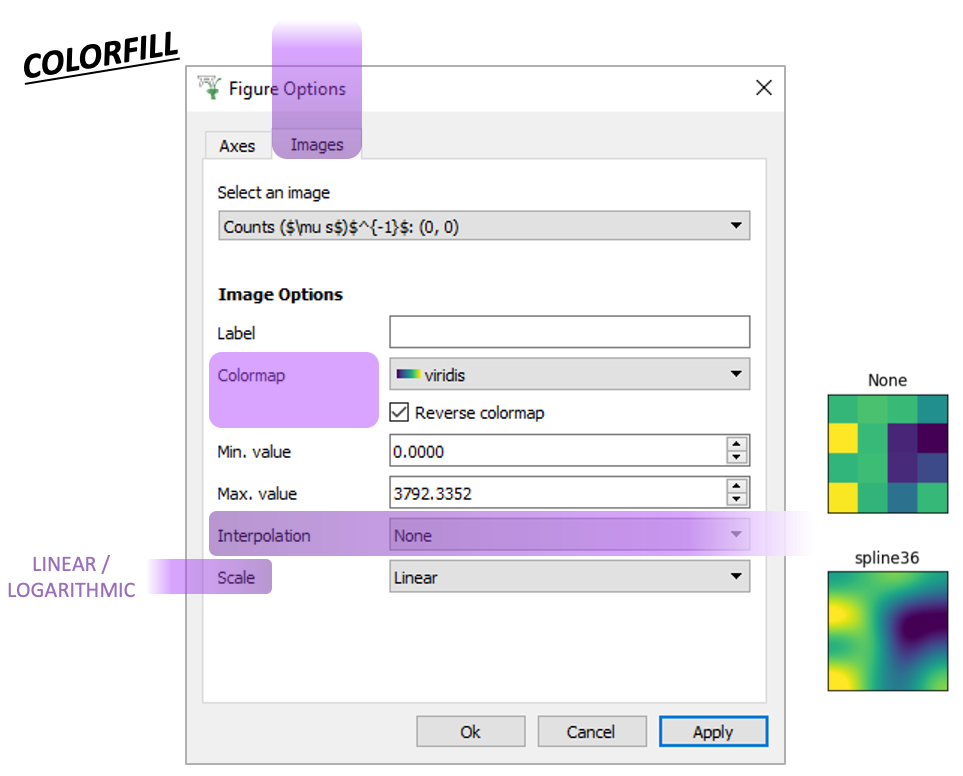
Image Plots#
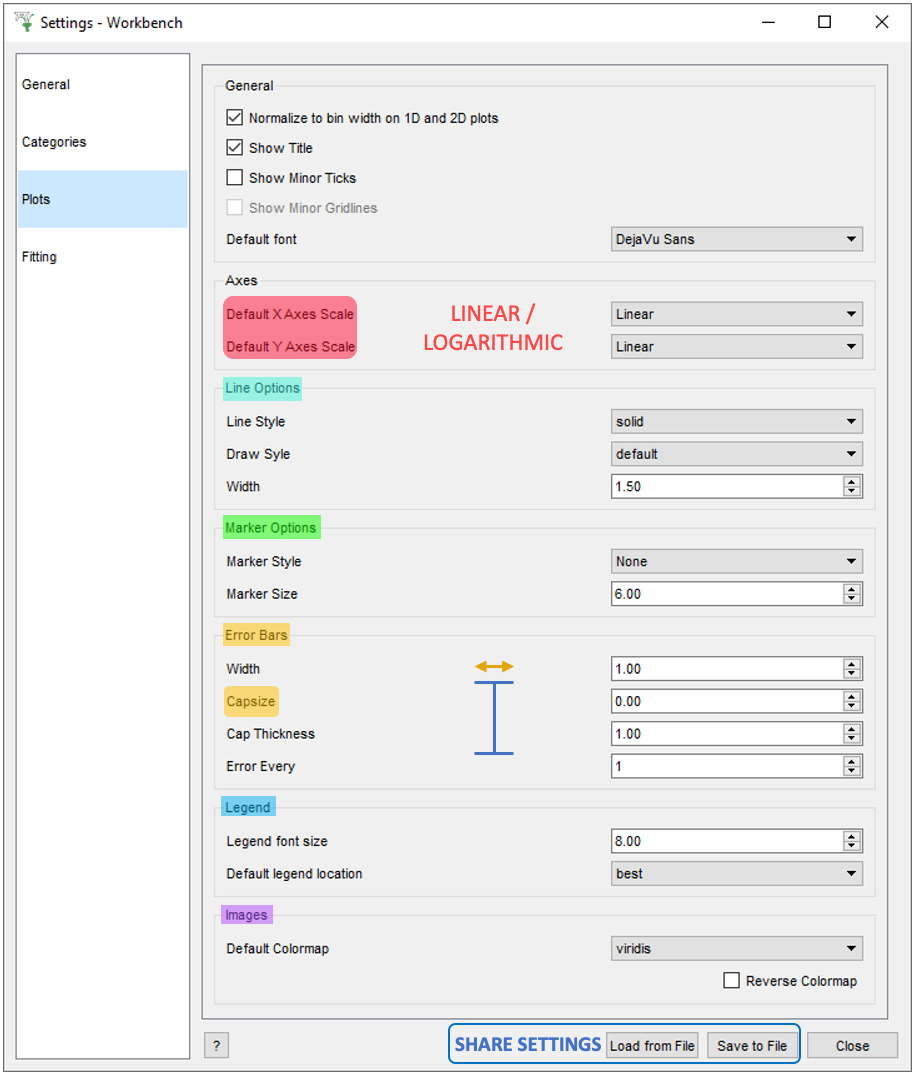
File > Settings#
Useful Key Shortcuts#
Mantid plots support multiple key shortcuts by default. Please note especially the shortcuts k and l, which are useful for quickly switching between linear and log axes scales.
Action |
Key shortcuts |
|---|---|
Toggle fullscreen |
f, ctrl+f |
Reset to homme |
h, r |
Go back to previous view |
c, backspace |
Go forward to next view |
v |
Pan |
p |
Zoom |
o |
Save |
s |
Quit figure |
q, ctrl+w, cmd+w |
Toggle major grids |
g |
Toggle minor grids |
G |
Switch x scale between log/linear |
k |
Switch y scale between log/linear |
l |
Other Plotting Documentation