\(\renewcommand\AA{\unicode{x212B}}\)
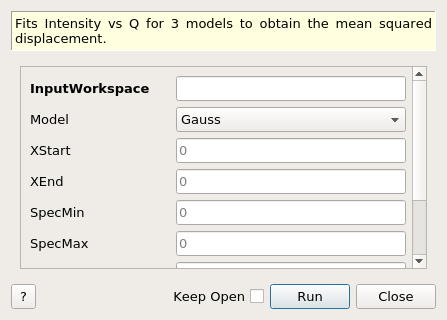
MSDFit dialog.
Table of Contents
| Name | Direction | Type | Default | Description |
|---|---|---|---|---|
| InputWorkspace | Input | MatrixWorkspace | Mandatory | Sample input workspace |
| Model | Input | string | Gauss | Model options : Gauss, Peters, Yi. Allowed values: [‘Gauss’, ‘Peters’, ‘Yi’] |
| XStart | Input | number | 0 | Start of fitting range |
| XEnd | Input | number | 0 | End of fitting range |
| SpecMin | Input | number | 0 | Start of spectra range to be fit |
| SpecMax | Input | number | 0 | End of spectra range to be fit |
| OutputWorkspace | Output | MatrixWorkspace | Mandatory | Output mean squared displacement |
| ParameterWorkspace | Output | TableWorkspace | Output fit parameters table | |
| FitWorkspaces | Output | WorkspaceGroup | Output fitted workspaces |
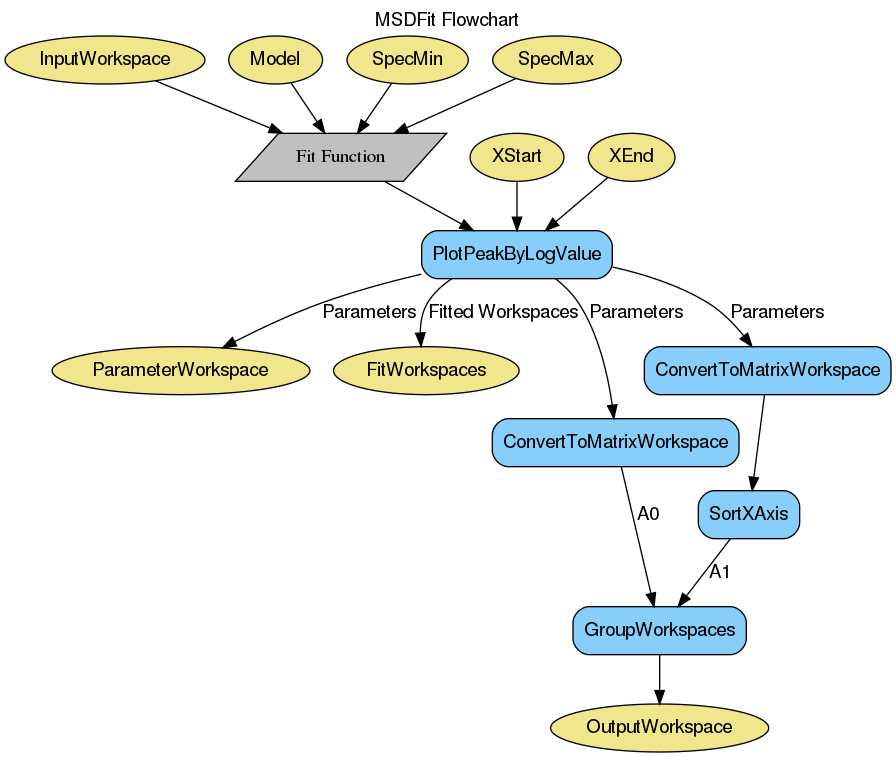
Fits \(intensity\) vs \(Q\) with a straight line for each run to obtain the mean square displacement for a given range of runs.
This algorithm operates on the \(Q\) workspace (_eq) generated by the ElasticWindowMultiple algorithm.
The model used for obtaining the mean squared displacement can be selected. These models include ‘Gaussian’, ‘Peters’, ‘Yi’.
Example - Performing MSDFit on simulated data.
# Create some data that is similar to the output of ElasticWindowMultiple
sample = CreateSampleWorkspace(Function='User Defined',
                UserDefinedFunction='name=ExpDecay,Height=1,Lifetime=6',
                NumBanks=1, BankPixelWidth=1, XUnit='momentum', XMin=0.0,
                XMax=5.0, BinWidth=0.1)

g_msd, g_param, g_fit = MSDFit(InputWorkspace=sample,
                               Model="Gauss",
                               XStart=0.0, XEnd=5.0,
                               SpecMin=0, SpecMax=0)

y_msd, y_param, y_fit = MSDFit(InputWorkspace=sample,
                               Model="Yi",
                               XStart=0.0, XEnd=5.0,
                               SpecMin=0, SpecMax=0)

print('Using Gauss Model')
print('A0: ' + str(g_msd.readY(0)))
print('A1: ' + str(g_msd.readY(1)))
print('Using Yi Model')
print('A0: ' + str(y_msd.readY(0)))
print('A1: ' + str(y_msd.readY(1)))
Output (the numbers on your machine my not match exactly):
  Using Gauss Model
  A0: [ 0.87...]
  A1: [ 0.19...]
  Using Yi Model
  A0: [ 0.95...]
  A1: [ 0.58...]
Categories: AlgorithmIndex | Workflow\MIDAS