\(\renewcommand\AA{\unicode{x212B}}\)
The Pick tab on the controls panel allows you to see the data in the workspace.
 - Navigate in the instrument display window (Zoom).
 - Edit a shape.
 - Draw an ellipse.
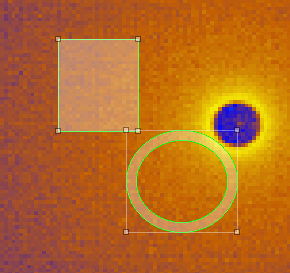
 - Draw a rectangle.
 - Draw an elliptical ring.
 - Draw a rectangular ring.
 - Draw a circular sector.
 - Draw an arbitrary shape.
 - Select a tube/bank.
 - Add a single crystal peak.
 - Erase a peak.
 - Compare single crystal peaks.
 - Crystal Peak alignment tool.
The Single Pixel tool  displays the detector
data in the mini-plot at the bottom of the tab.
displays the detector
data in the mini-plot at the bottom of the tab.
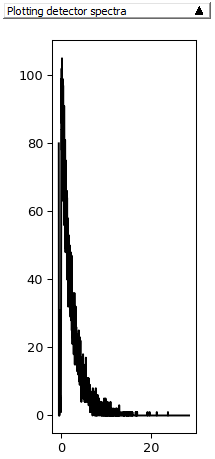
Hover the mouse over a detector and see the mini-plot update.
To zoom in on this mini-plot, select the button, then click and drag on the mini-plot.
If you don’t drag (just click), you will add a SingleCrystalPeak (appearing in a new TableWorkspace).
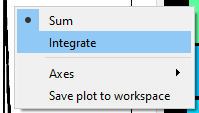
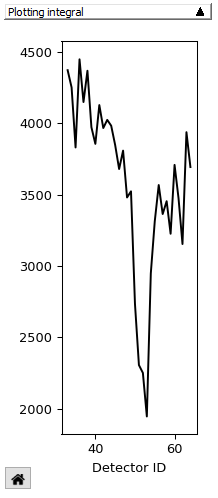
The Tube selection tool  is useful for tube instruments.
When it’s on the mini-plot displays the integrated data in the whole
tube. The integration is done either over the detectors in the tube (Sum
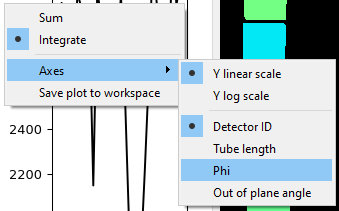
option) or over time (Integrate). To switch between the options, right-click on the mini-plot
to display the following menu:
is useful for tube instruments.
When it’s on the mini-plot displays the integrated data in the whole
tube. The integration is done either over the detectors in the tube (Sum
option) or over time (Integrate). To switch between the options, right-click on the mini-plot
to display the following menu:
With the Sum option the mini-plot displays a sum of the counts in all detectors in a tube vs time of flight.
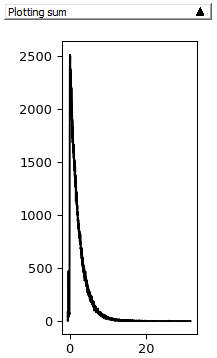
With the Integrate option the mini-plot displays the counts integrated over time of flight vs detector position in the tube.
The tool button switches on the navigation mode
which is the same as in Render Tab.
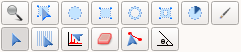
The rest of the buttons in the top row are for making complex
selections. Buttons
are for drawing shapes, is for editing them.
button.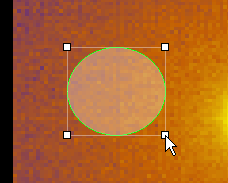 .
.To select multiple shapes draw a rubber band around them.
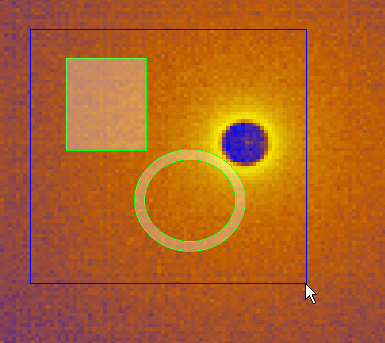
The selected shapes are indicated by drawing a bounding box around each of them.
Only translation is possible for a multiple selection.
The mini-plot automatically sums the counts in the detectors covered by the shapes and plots this vs time of flight.