\(\renewcommand\AA{\unicode{x212B}}\)
PolynomialCorrection v1
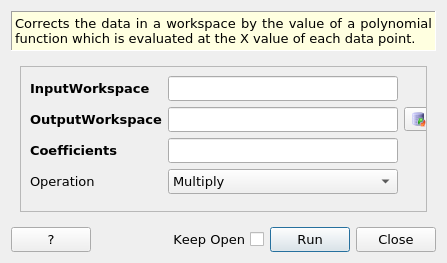
PolynomialCorrection dialog.
Summary
Corrects the data in a workspace by the value of a polynomial function which is evaluated at the X value of each data point.
See Also
OneMinusExponentialCor, MagFormFactorCorrection, ExponentialCorrection, PowerLawCorrection
Properties
Name |
Direction |
Type |
Default |
Description |
|---|---|---|---|---|
InputWorkspace |
Input |
Mandatory |
The name of the input workspace |
|
OutputWorkspace |
Output |
Mandatory |
The name to use for the output workspace (can be the same as the input one). |
|
Coefficients |
Input |
dbl list |
Mandatory |
Array Property containing the coefficients of the polynomial correction function in ascending powers of X. Can be given as a comma separated list in string form. |
Operation |
Input |
string |
Multiply |
The operation with which the correction is applied to the data (default: Multiply). Allowed values: [‘Multiply’, ‘Divide’] |
Description
Corrects the data and error values on a workspace by the value of a polynomial function using the chosen operation. The correction factor is defined by
where N is the order of the polynomial specified by the length of the Coefficients property. The factor is evaluated at the x value of each data point (using the mid-point of the bin as the x value for histogram data.
Usage
Example: divide data by a quadratic:
# create histogram workspace
dataX = [0,1,2,3,4,5,6,7,8,9] # or use dataX=range(0,10)
dataY = [1,2,3,4,5,6,7,8,9]
dataE = [1,2,3,4,5,6,7,8,9]
data_ws = CreateWorkspace(dataX, dataY, DataE=dataE)

coefficients = [1., 3., 5.] #  1 + 3x + 5x^2
data_ws = PolynomialCorrection(data_ws, coefficients, Operation="Divide")

print("First 5 y values: {}".format(data_ws.readY(0)[0:5]))
print("First 5 error values: {}".format(data_ws.readE(0)[0:5]))
First 5 y values: [ 0.26666667  0.11940299  0.0754717   0.05498282  0.04319654]
First 5 error values: [ 0.26666667  0.11940299  0.0754717   0.05498282  0.04319654]
Example: multiply data by a linear:
# create histogram workspace
dataX = [0,1,2,3,4,5,6,7,8,9] # or use dataX=range(0,10)
dataY = [1,2,3,4,5,6,7,8,9]
dataE = [1,2,3,4,5,6,7,8,9]
data_ws = CreateWorkspace(dataX, dataY, DataE=dataE)

coefficients = [2., 4.] #  2 + 4x
data_ws = PolynomialCorrection(data_ws, coefficients, Operation="Multiply")

print("First 5 y values: {}".format(data_ws.readY(0)[0:5]))
print("First 5 error values: {}".format(data_ws.readE(0)[0:5]))
First 5 y values: [   4.   16.   36.   64.  100.]
First 5 error values: [   4.   16.   36.   64.  100.]
Categories: AlgorithmIndex | CorrectionFunctions
Source
C++ header: PolynomialCorrection.h
C++ source: PolynomialCorrection.cpp