\(\renewcommand\AA{\unicode{x212B}}\)
MantidWorkbench Changes
Installation
Linux desktops now have an icon to launch the workbench without using the terminal.
User interface
All icons have been replaced with icons from Material Design: https://material.io/tools/icons.
You can now double-click the numbers on a figure axis to adjust the axis’ scale.
Mantid’s offline help is now available in Workbench.
You can now save, load and delete custom layouts from the settings menu with quick access to user layout in the view menu.
Typing an algorithm name in the algorithms search box now searches all algorithms including those in hidden categories.
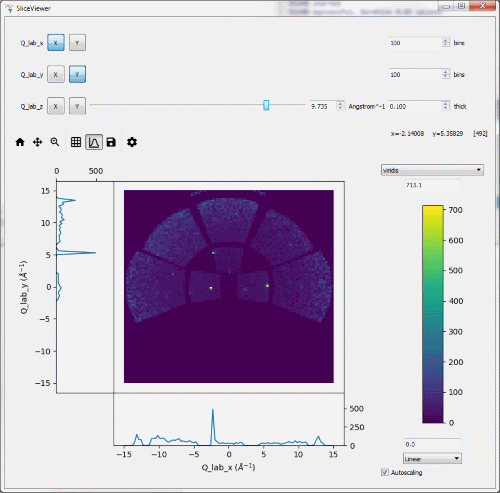
SliceViewer
We have merged much of the functionality of the Spectrum Viewer and Slice Viewer from Mantidplot into a single useful tool.
It works much like the previous SliceViewer tool, plotting any MatrixWorkspace or MDWorkspaces, and allowing the 2 axes for plotting to be selected, while presenting a slider for additional dimensions.
The side plot toolbar button (that looks like a curve plot) adds line plot vertically and horizontally that will dynamically update as you move your mouse cursor across the plot.
Support for some of the more advanced features of the old sliceViewer such as non-orthogonal axes, extracting slices to other workspaces and displying peaks will be included in future releases.
Scientific Interfaces
Many of the interfaces that were missing from Workbench v4.0 have now been integrated into this release, including:
ISIS Reflectometry
Muon:
ALC
Elemental Analysis
Frequency Domain Analysis
Muon Analysis 2
Indirect:
Corrections
Data Reduction
Diffraction
Settings
Simulations
Tools
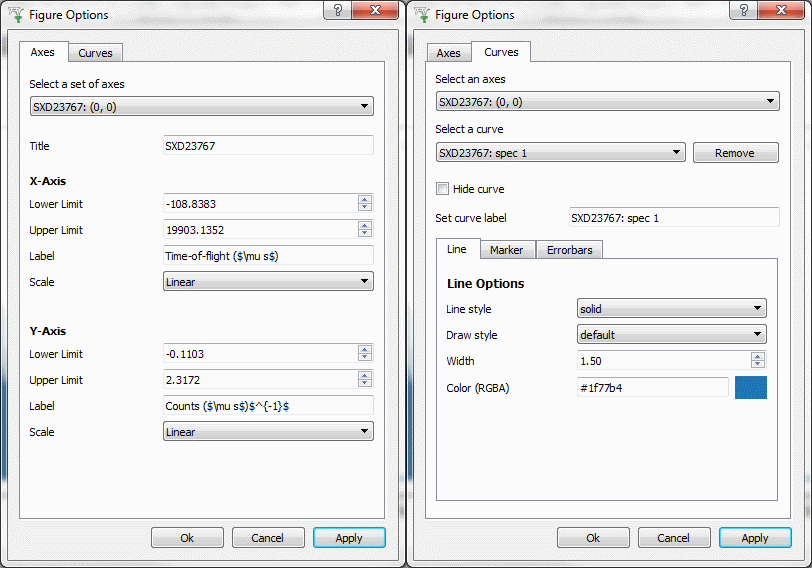
Plotting
The plot options dialog has been improved to offer you more control over your figures.
You can now plot workspaces on top of figures you’ve created using scripts. Simply create a matplotlib figure in the script window, then drag and drop a workspace on top of it.
A colorfill plot of a workspace with logarithmic bins is plotted on a log scale.
You can now toggle the normalization of plots in Workbench from the plot’s context menu.
Double-clicking a workspace now opens a prompt to plot the workspace, instead of displaying its data.
The plot windows now have a Mouse right-click context menu that allows showing/hiding error bars for each plotted line.
Scripting
Single line commenting in the script editor is now enabled without needing to highlight any text.
You can now import from local python files that are in the same directory as the script you’re executing.
Bugfixes
An error raised when double-clicking an arrow in the algorithm toolbox. when no algorithm was selected has been fixed.
Help documentation for the manage user directories interface now correctly displays when launched from the interface.
A Colorfill plot of a workspace with one spectrum plots correctly and no longer raises an error.
The units on the y-axis of distribution workspace plots have been corrected.
Restore Default Layout no longer resizes the main window.
Entering an invalid number into a plot’s axis editor no longer causes an uncaught error
Workbench’s scaling of fonts when moved between monitors with different resolutions has been improved
The ErrorReporter window is now resizeable
The “Fit” button is now visible when plotting a spectrum with error bars
Project save handles workspace saving erros more gracefully
Known Issues
Fit parameters in the fit browser are not updated when performing a simultaneous fit.
The fit and difference curves are not plotted on the associated figure for a simultaneous fit.