\(\renewcommand\AA{\unicode{x212B}}\)
Mantid Workbench Changes
New
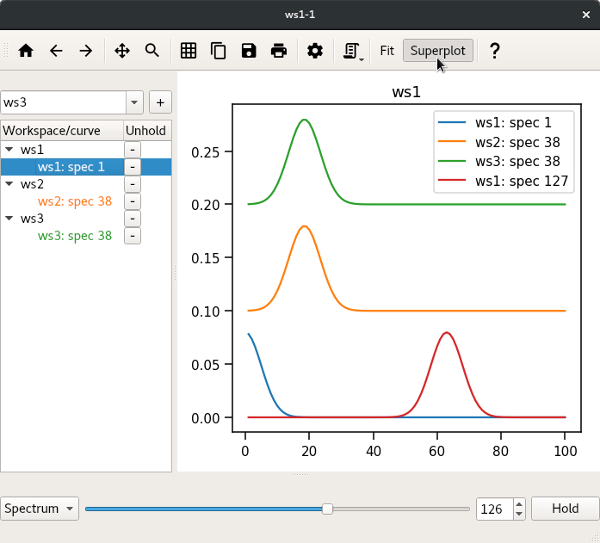
Superplot is a new decorator widget for the plot window. It facilitates over-plotting and manipulation of overplotted data. See Superplot documentation for more information.
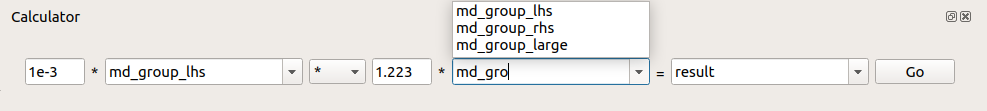
New widget and workbench plugin: The Workspace Calculator , allows users to quickly perform binary operations on selected workspace pairs, optionally with scaling; This will require your widget layout to be reset when starting workbench v6.2.0 for the first time. Previously saved layouts accessible from
View > User Layoutsmay need to be saved again to include the Workspace Calculator widget.
Improvements
Workflow diagrams in help pages are now
.svgrather than.png.When fitting a plot, selecting the peak type will only update the default peak shape in the settings if the
Set as global defaultcheckbox is ticked.Plot legends can be shown or hidden from the plot context menu.
The plot config dialog notifies the user when there has been an error applying the config to the plot, and allows them to change the config further.
When fitting a plot, selecting the peak type will only update the default peak shape in the settings if the “Set as global default” checkbox is ticked.
The list of eligible workspaces in the WorkspaceSelector can now be sorted by name.
Script editor code completion support for Numpy 1.21.
The visibility of a component parameter in the Pick tab of the Instrument Viewer Widget is now steered by the ‘visible’ attribute of a parameter in IPF.
ADS signal handlers are now synchronized in WorkspaceSelector. This reduces the probability of hard crash when interacting with the widget while a script manipulating a large number of workspaces is being run.
Bugfixes
Gridcheckbox inEdit axisdialog, andGrids on/offtoolbar button will now have the correct checked state when running a plot script with major grid lines.Fixed a bug in colorfill plots which lead to the loss of a spectrum from the resulting image.
Fixed a bug where removing the plot guess line in the fit browser could lead to an exception being thrown.
Fixed the advanced plotting dialog incorrect layout, which caused the options to be partially occluded.
Scroll bars added to about dialog if screen resolution is too low.
Fixed missing ‘on top’ windowing behaviour for the matrix and table workspace data displays.
Uninstalling from Windows “Apps & features” list will now run the uninstaller as the current Windows user and delete all shortcuts.
Added missing icon for the uninstaller in Windows “Apps & features” list.
Fixed a bug where parameters wouldn’t update in the fit property browser when fitting a single function with ties.
Fixed a bug where the workspace index spinbox in the fit browser wouldn’t update when the user added or removed curves from the figure.
Fixed a bug retrieving algorithm history from a workspace when the retrieval methods were chained together.
Fixed a bug where output workspaces of different types would interfere with successive calls to binary operations, such as multiply.
Fixed JSON serialization issue of MantidAxType by explicitly extracting its value.
Fixed a bug where the errorbar tab in the figure options was wrongly enabled while selecting multiple curves.
Fixed a bug where marker formatting options were disabled upon opening the figure options.
Fixed the help icon not showing on OSX and high-resolution monitors.
Tabbing between fields in the error reporter now works as expected, rather than jumping to a random place each time.
Fixed a bug in the Instrument Viewer Widget causing the projection to not be updated when different axis views were selected in Full 3D.
Sliceviewer
Improvements
Peaks can now be added or removed from a PeaksWorkspace using the PeaksWorkspace overlay.
Added tooltips to all the widgets. Please contact the developers if any are missing.
Added a help button.
There is now a more visible divider between the main data view and the peaks table view.
Users can load a customized colormap from the colorbar directory upon starting.
Bugfixes
No longer normalises basis vectors for HKL data such that Bragg peaks appear at integer HKL for cuts along e.g. HH0.
Fixed a bug that when transposing MDE workspaces multiple times it would cause the data to become all zeros.
Fixed out of range errors that sometimes occurred whilst hovering over transposed data.
Users can toggle between different scales again without any issue.
Fix bug where non-orthogonal view was enabled on an orthogonal workspace with no UB.
Fixed cursor tracking from getting stuck and displaying incorrect signals when viewing MDHistogram workspaces.
Fixed bug in resetting axes limits in non-orthogonal view when a plot is updated.