Debugging#
This pages contains some Mantid Imaging specific debugging tips.
Getting Debug Output#
There are several options that can be used so that Mantid Imaging outputs more information as it runs, for example:
python -X faulthandler -W default -m mantidimaging --log-level DEBUG
These options:
Enable the
faulthandlerto dump a traceback in the event of python crash.Cause python
warningsto be printed.Set the Mantid Imaging
log levelto DEBUG.
Logs are written using the Python logging module. Mantid Imaging files should access the logger using:
from logging import getLogger
...
LOG = getLogger(__name__)
and then output using:
LOG.debug(f'Loaded metadata from: {metadata_filename}')
To avoid large amounts of output, logging messages should only be merged if they are likely to be useful for general debugging.
Debugging Github Actions#
When errors happen on Github actions it is best to try to reproduce them locally. When that is not possible it may be required to debug them by creating runs by adding commits to a test pull request. In messy cases, it can be best to create a clone of the mantid imaging repository into your Github user account. If you are doing this on the main repository, put DONTMERGE in the PR title and commit messages to prevent any accidental merging.
It is usually useful to disable any actions that are not relevant to your issue. On your branch you can delete any un-needed workflows:
git rm .github/workflows/windows.yml ...
git commit -m "DONTMERGE: disable workflows"
If the failure is in a specific test, pytest can be told to only run those by adding a -k option:
- name: pytest
timeout-minutes: 10
shell: bash -l {0}
run: |
  xvfb-run --auto-servernum python -m pytest --cov --cov-report=xml -n auto -o log_cli=true --ignore=mantidimaging/eyes_tests --durations=10 -k test_parse_metadata_file
In the case of unreliable test failures, it can be useful to repeat part of the workflow. The if: success() || failure() means that each step will run even if previous ones have failed:
- name: GUI Tests System 1
  if: success() || failure()
  shell: bash -l {0}
  run: |
    xvfb-run --auto-servernum /bin/time -v python -m pytest -vs -rs -p no:xdist -p no:randomly -p no:repeat -p no:cov -o log_cli=true --run-system-tests --durations=10
  timeout-minutes: 30

- name: GUI Tests System 2
  if: success() || failure()
  shell: bash -l {0}
  run: |
    xvfb-run --auto-servernum /bin/time -v python -m pytest -vs -rs -p no:xdist -p no:randomly -p no:repeat -p no:cov -o log_cli=true --run-system-tests --durations=10
  timeout-minutes: 30
See Status check functions for details.
Trigger a Debug Function When Running#
It can sometimes be useful to a piece of code that can be triggered from a keyboard short cut, for example to output some values or state. This can be done by adding a QShortcut and connecting to a function. For example in the constructor of the view part of a window, e.g. for the spectrum viewer it would be in SpectrumViewerWindowView.__init__(). Add the following:
self.shortcut_debug = QShortcut(QKeySequence('Ctrl+D'), self)
self.shortcut_debug.activated.connect(self.presenter.output_debug_info)
And then add a output_debug_info with the output that you need. It will be run every time Ctrl+D is pressed.
How to debug Python tests#
Prerequisites#
Ensure the Python Debugger is installed.
For more details on how VS Code debugging works, see the official VS Code debugging documentation.
Configure the debugger#
Open the existing launch.json file through the the file finder and update the args in "Python: Debugger: Current File" configuration to specify the tests to run. To enable unit, eyes and system tests, make the following updates:
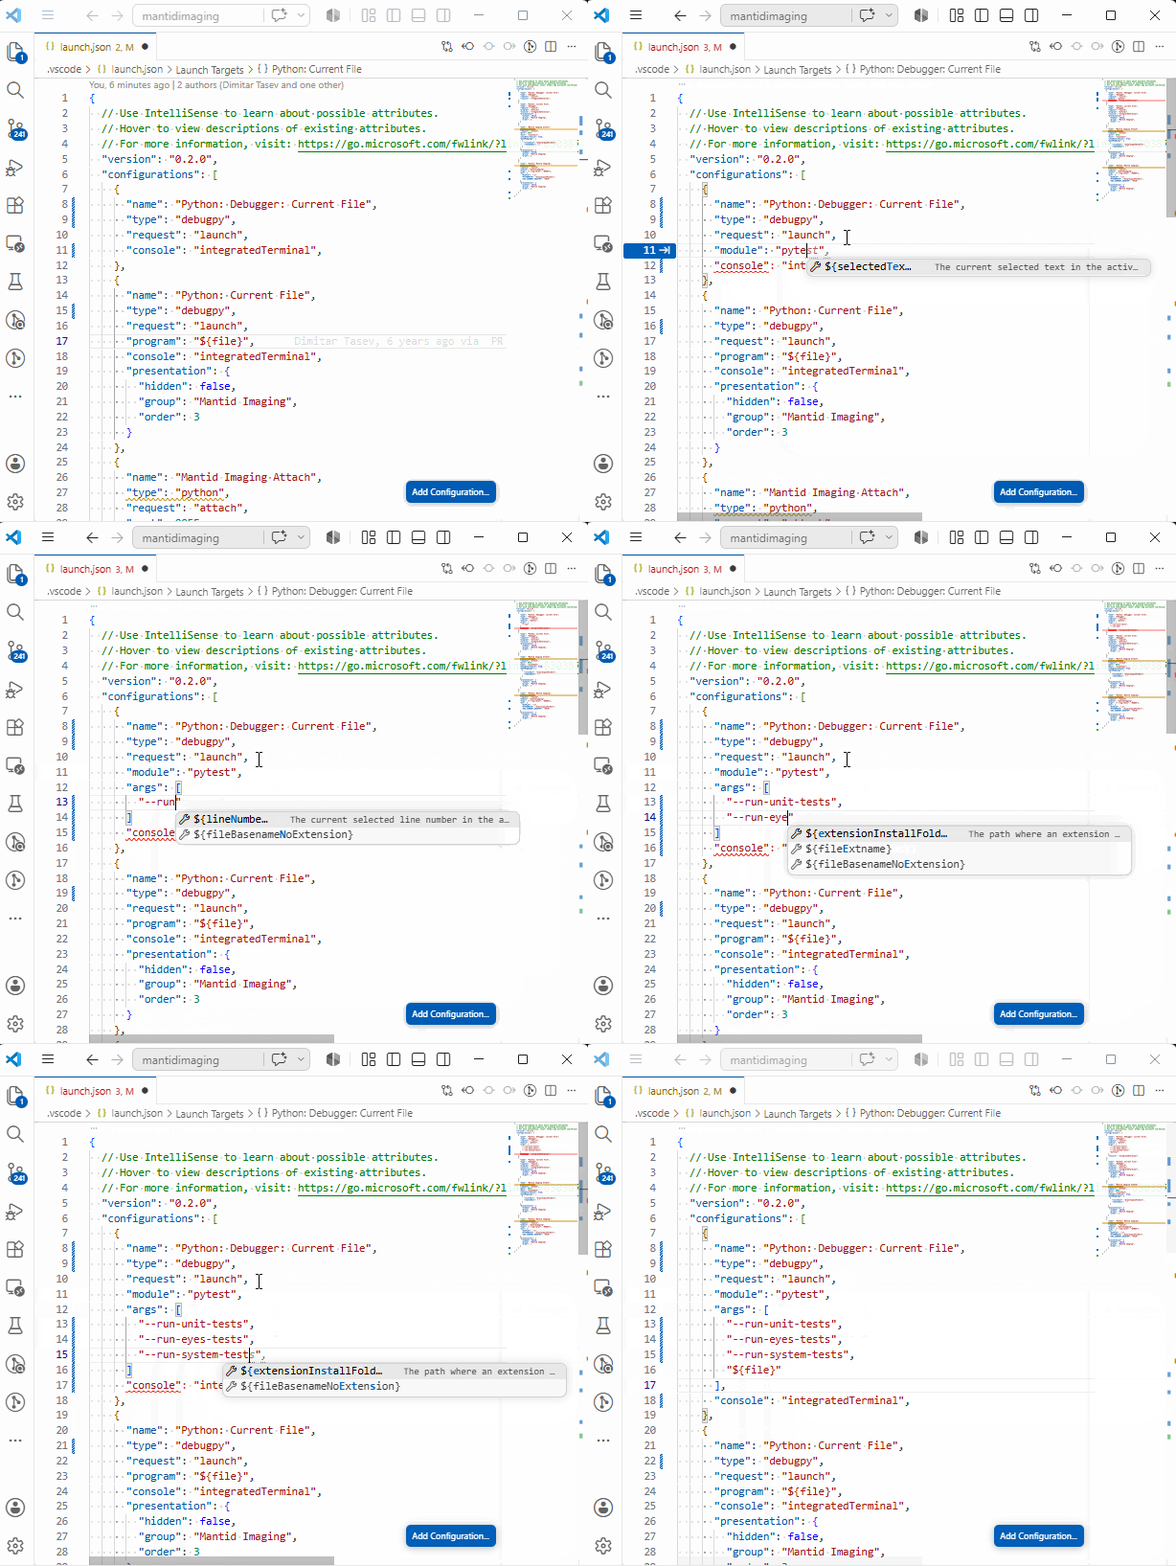
Enabling test run in VSCode#
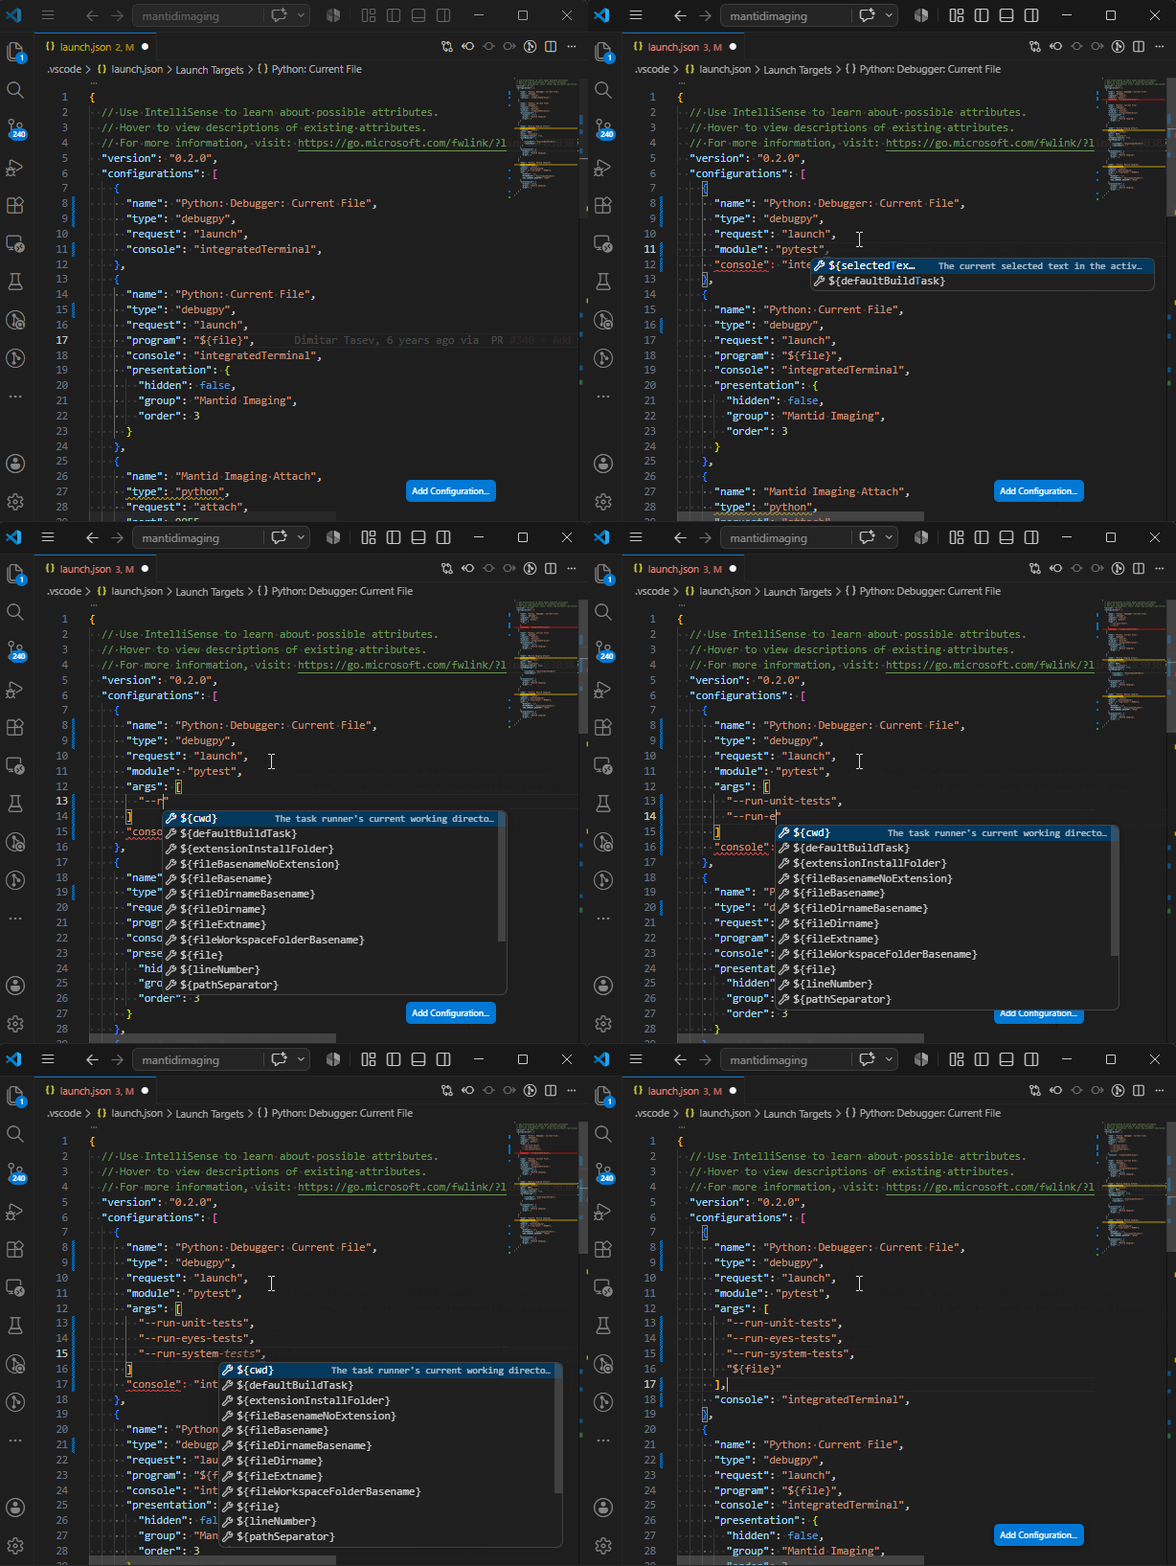
Enabling test run in VSCode#
Example configuration:
{
  "name": "Python: Debugger: Current File",
  "type": "debugpy",
  "request": "launch",
  "module": "pytest",
  "console": "integratedTerminal",
  "args": [
    "--run-unit-tests",
    "--run-eyes-tests",
    "--run-system-tests",
    "${file}"
  ]
}
If a Python interpreter has been selected in VS Code, the debugger will use that interpreter automatically. See Selecting the Python interpreter.
Alternatively, an interpreter can be specified explicitly using the python field:
"python": "C:/Users/<username>/AppData/Local/miniforge3/envs/mantidimaging-dev/python.exe"
Headless / SSH configuration#
When working over SSH or without a display server, GUI backends must be disabled.
Add environment variables:
"env": {
  "QT_QPA_PLATFORM": "offscreen",
  "MPLBACKEND": "Agg"
}
Example configuration:
{
  "name": "Headless: All Unit Tests",
  "type": "debugpy",
  "request": "launch",
  "python": "${workspaceFolder}/.pixi/envs/dev/bin/python",
  "module": "pytest",
  "console": "integratedTerminal",
  "args": [
      "--run-unit-tests",
      "-pno:django",
      "${workspaceFolder}/mantidimaging"
  ],
  "env": {
      "QT_QPA_PLATFORM": "offscreen",
      "MPLBACKEND": "Agg"
  },
  "presentation": {
      "hidden": false,
      "group": "Mantid Imaging",
      "order": 3
  }
},
Run the debugger#
Open the test file
Set breakpoints beside line numbers
Open the Run and Debug sidebar
Select
Python: Debugger: Current FilePress the green play button
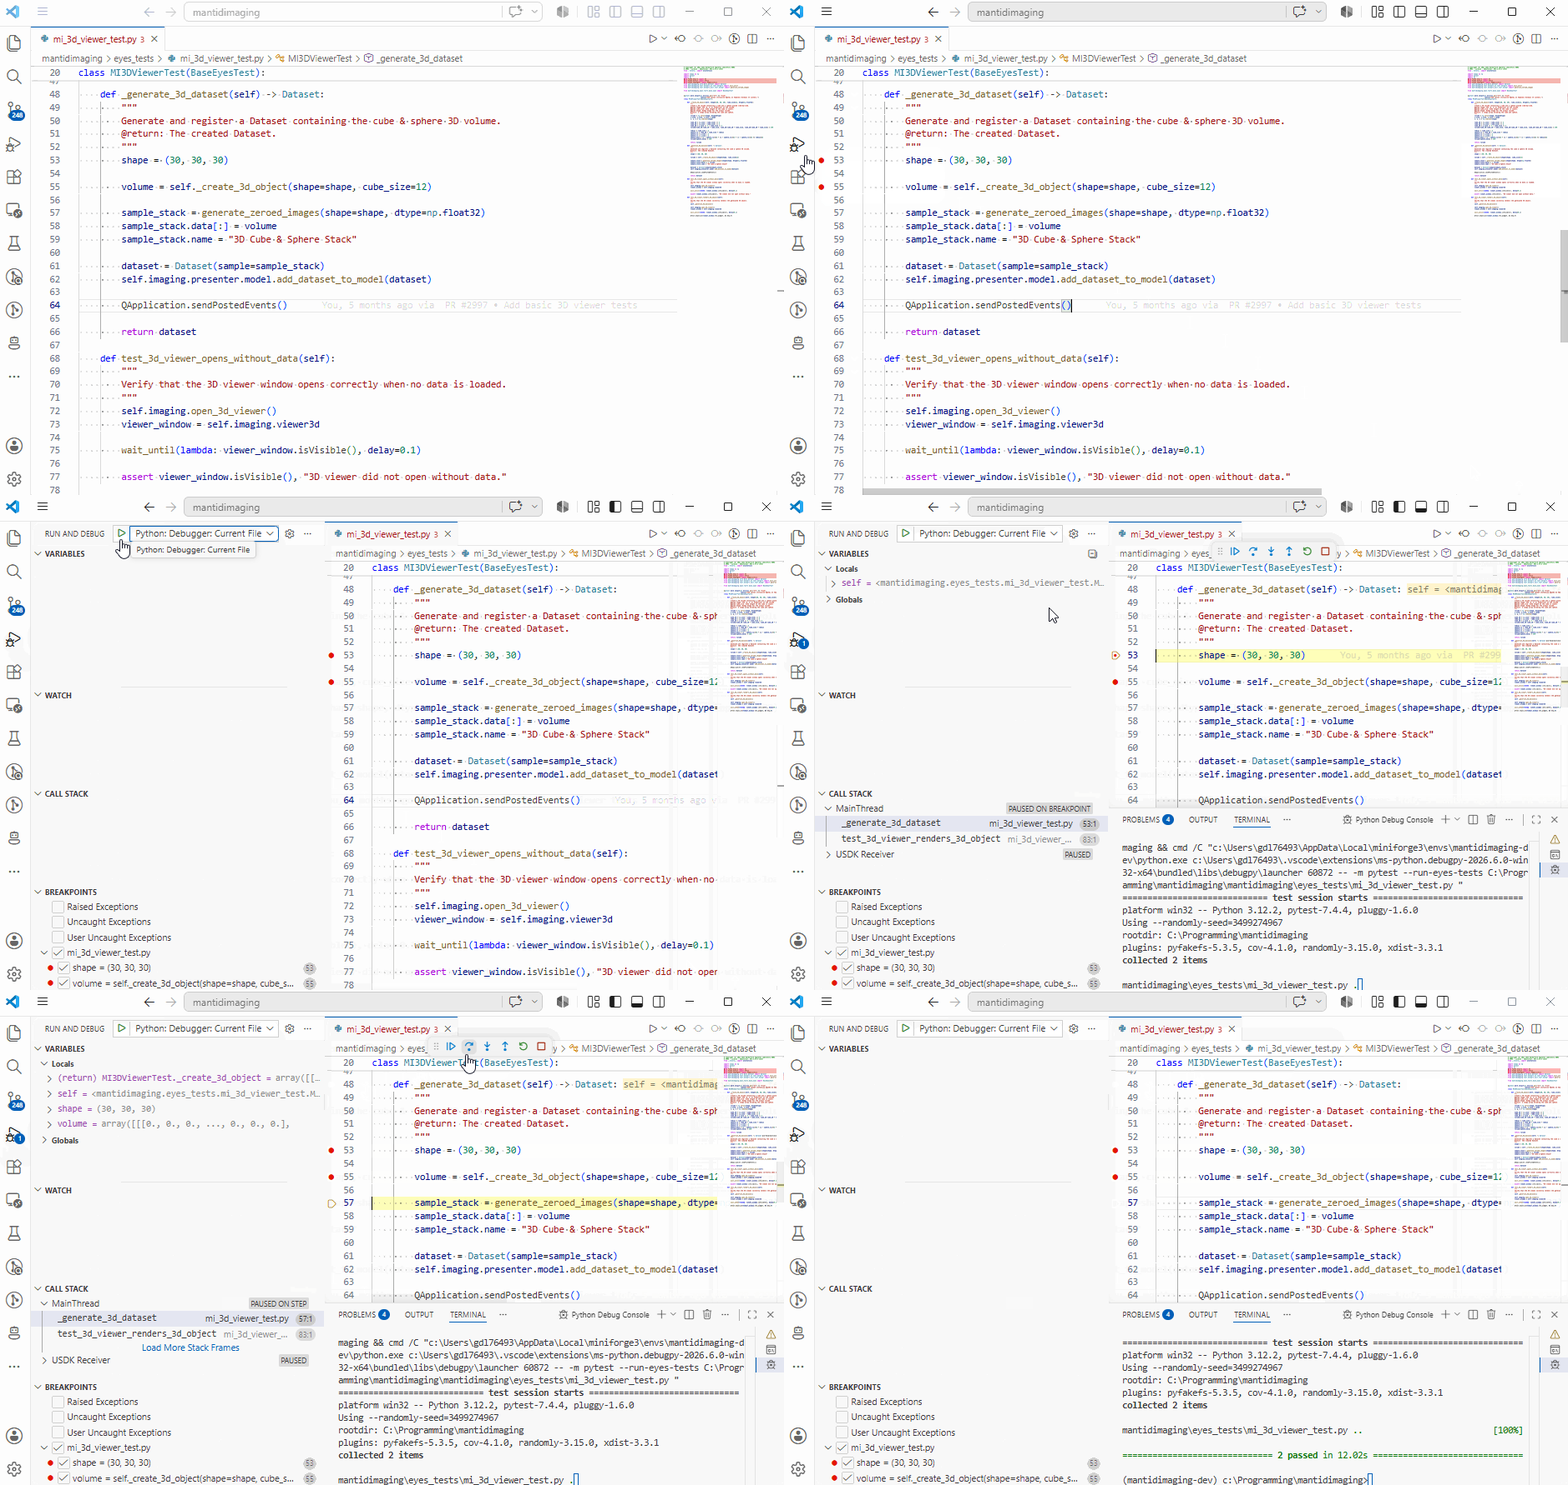
Running eyes tests in VSCode#
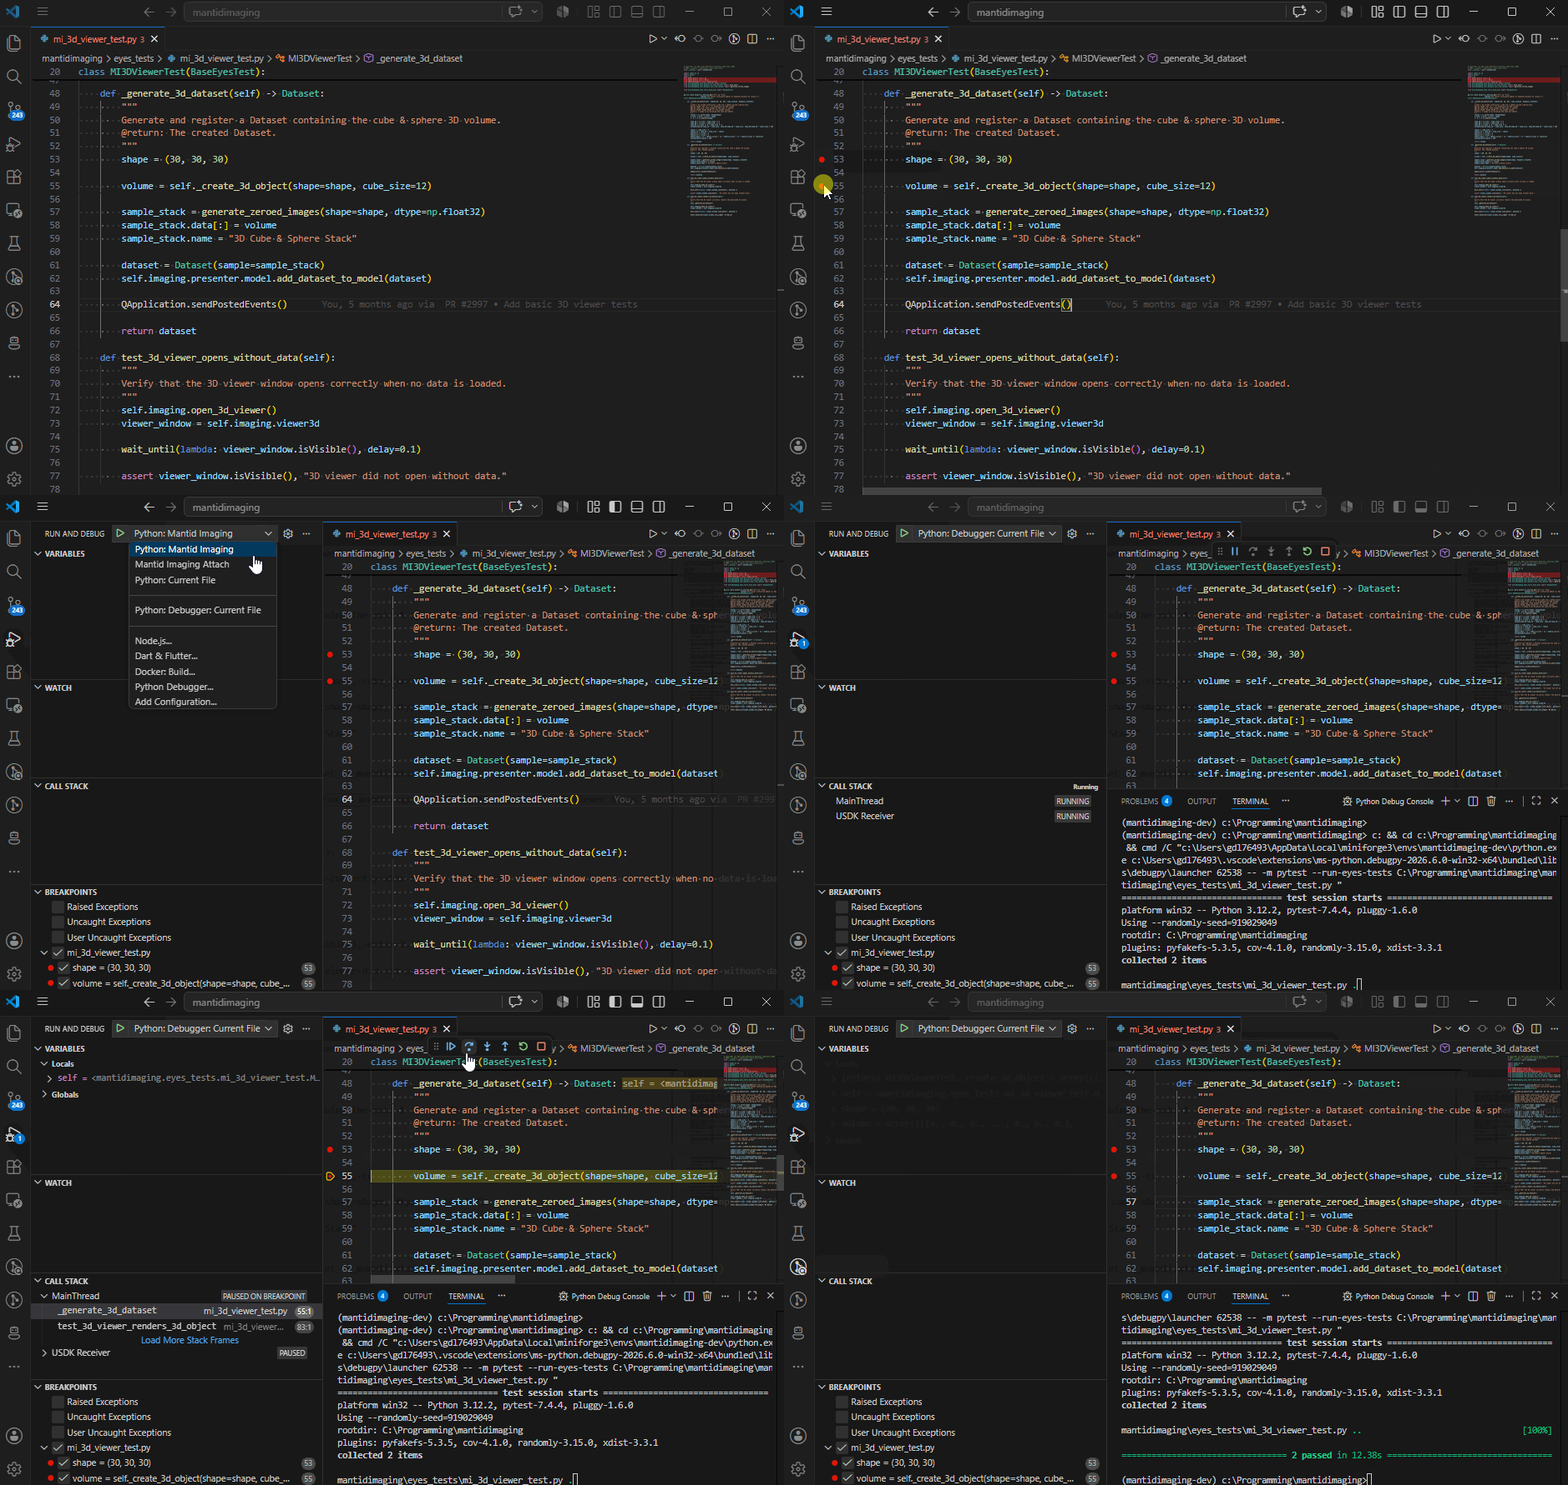
Running eyes tests in VSCode#
The debugger will pause execution at breakpoints, allowing variables and execution flow to be inspected.